Loading...

Introduction to the USDT vs USDC vs DAI Marketcap Chart

As you venture into the crypto sphere, the importance of an insightful companion cannot be overstated. Our interactive chart, showcasing the historic market capitalization of USDT, USDC, and DAI, serves as a beacon for both the curious minds and seasoned crypto analysts among us.

Here, we unfurl the financial tapestry where these prominent stablecoins have etched their marks. With every rise and dip in market cap illuminated on our chart, the nuanced dance of market dynamics becomes a visual narrative.

This is not merely a depiction of numbers, but a journey through the financial vigor and adaptability these digital assets exhibit.

Understanding Stablecoin Market Dynamics: A Deep Dive

Stablecoins play a pivotal role in the cryptocurrency ecosystem by providing a refuge from the notorious volatility associated with other digital assets like Bitcoin and Ethereum.

The stablecoins USDT (Tether), USDC (USD Coin), and DAI are emblematic of this utility, each tethered to the stability of traditional fiat currencies albeit through different mechanisms.

The market capitalization of these stablecoins is not just a reflection of trust but an indicator of the broader acceptance and integration of cryptocurrencies in the financial markets. Our USDT, USDC and DAI Marketcap Chart elucidates the historical trajectory of USDT, USDC, and DAI's market cap, offering a lens to view the shifting sands of investor confidence and regulatory landscapes.

A closer examination of the "USDT vs USDC vs DAI Marketcap Chart" reveals intriguing patterns of market behavior. For instance, as a whole, a plateau or decline in the total stable coin market cap might coincide with turbulent times in the broader crypto market, underscoring the safe haven appeal of stablecoins.

Conversely, an increase may reflect a return of investor confidence to more volatile assets or perhaps regulatory headwinds. Moreover, the comparative analysis of these three stablecoins sheds light on their individual strengths and weaknesses in terms of governance, transparency, and operational efficiency.

As we dissect these market cap trends, we unearth the nuanced interplay of market forces that shape the stablecoin arena, offering a well-rounded understanding crucial for both seasoned investors and newcomers to the cryptocurrency domain.

Key Factors Influencing Stablecoin Market Capitalization

The market capitalization of stablecoins like USDT, USDC, and DAI is predominantly driven by the number of coins in existence, which in turn, is influenced by a myriad of factors both within and outside the cryptocurrency market.

On a macroeconomic level, traditional market conditions and monetary policies can significantly impact the demand for stablecoins. For instance, during times of economic uncertainty or inflation, investors might flock to stablecoins as a means to preserve capital. Investors might also cash in their stable coins for real US dollars in times of uncertainty.

Similarly, favorable regulatory environments can foster a conducive atmosphere for stablecoin adoption, thereby increasing their market cap.

Within the cryptocurrency market, the volatility of more speculative assets like Bitcoin and Ethereum often drives investors towards the relative stability offered by stablecoins. This dynamic also increases the total stable coin dominance and the Bitcoin dominance.

The demand for stablecoins generally surges during bear markets or periods of heightened uncertainty, providing a buffer against volatile market conditions.

It is also notable that the general supply of stablecoins reduces in bear markets as a result of investors, speculators and retail adopters leaving the crypto space. They usually do so by redeeming stable coins for US dollars.

Additionally, the utility and integration of stablecoins in decentralized finance (DeFi) platforms significantly influence their market cap. As the backbone of many DeFi applications, stablecoins facilitate a plethora of transactions and smart contract interactions, with their market cap often mirroring the growth and contraction of the DeFi space.

Furthermore, the governance and operational mechanisms of individual stablecoins can have a marked impact on their market capitalization.

For example, the algorithmic stabilization mechanism of DAI contrasts with the fiat-collateralized nature of USDT and USDC, leading to different market cap behaviors under similar market conditions. The trust and transparency associated with the issuing entities also play a critical role.

A well-governed, transparent stablecoin is likely to foster greater trust among investors, hence attracting more capital. The comparative exploration of USDT, USDC, and DAI market capitalizations in our chart encapsulates these dynamics, offering a holistic view of the factors that shape the stablecoin market.

Stablecoins and Their Impact on the Broader Cryptocurrency Market

Stablecoins like USDT, USDC, and DAI have emerged as significant players in the cryptocurrency market, acting as bridges between the traditional financial realm and the burgeoning world of digital assets.

Their impact extends to the broader cryptocurrency market, notably influencing the price trends of major cryptocurrencies like Bitcoin (BTC). Being pegged to stable fiat currencies, these stablecoins offer a safe haven during tumultuous market phases, providing a steady base value.

When the market faces downward pressure, investors often transfer their holdings into stablecoins to avoid loss, and conversely, they may trade these stablecoins for BTC and other cryptocurrencies when the market sentiment is bullish.

Furthermore, stablecoins play a pivotal role as liquidity providers in the cryptocurrency market. The ease of trading in and out of stablecoins like USDT, USDC, and DAI facilitates a smoother market operation, ensuring that liquidity remains intact even during volatile periods.

This liquidity provision is crucial for the stability and growth of the cryptocurrency market, providing a more favorable environment for both retail and institutional investors.

The trading pairs of USDT, USDC, and DAI with BTC and other major cryptocurrencies are among the most traded pairs in the crypto market, indicating the intertwined relationship between stablecoins and other digital assets.

The liquidity and stability offered by these pairs attracts a significant volume of trading, which in turn impacts the price discovery and volatility of cryptocurrencies like BTC.

Moreover, the acceptance and utility of stablecoins within decentralized finance (DeFi) platforms further intertwine their market dynamics with the broader cryptocurrency market, often acting as a barometer for overall market health.

Lastly, the regulatory stance towards stablecoins can indirectly impact the broader cryptocurrency market. A favorable regulatory environment for stablecoins like USDT, USDC, and DAI can boost investor confidence, enhancing the attractiveness of the cryptocurrency space as a whole.

Conversely, regulatory clampdowns may deter investor participation, which may reverberate through the market, affecting the price and volatility of BTC and other cryptocurrencies. Through our historic market cap chart, the interplay between stablecoins and the broader cryptocurrency market unfolds, offering a glimpse into the complex market mechanisms at play.

Investment Insights: Drawing Inferences from Market Cap Fluctuations.

There are multiple conclusions that can be drawn from analyzing the USDT, USDC and DAI marketcap chart. Cryptocurrency market insights can be drawn from this analysis. These insights, coupled with insights obtained from other indicators, data points or market briefings can help us attain a macro image of what is really going on in the cryptocurrency world.

What insights can be drawn from the USDT, USDC and DAI Marketcap chart? Let’s take a look down below.

It should be noted that DAI is backed by many collateralized assets via MakerDAO. USDC and USDT are some of the collateralized assets that back up DAI’s value.

Thus, using this chart does have its limitations because it assumes that all USDC and USDC are circulating, when instead they can be used to create and back DAI stable coins.

Liquidity Movement Analysis

Since these 3 are some of the biggest stable coins in the cryptocurrency market, liquidity moves from one stablecoin to another. Liquidity from the outside, traditional finance world also moves into preferred stablecoins over other stablecoins. People often swap between stablecoins too. For example, in centralized exchanges, people may swap between USDT, USDC, DAI and Bitcoin or Ethereum to get in and out of the markets.

In the chart below, we can see periods where the market as a whole moved from one stable coin to another. This illustrates a preference for one stable coin over the rest. It also shows that the market is confident in that one particular stable coin.

For example, a large percentage was moved from USDC to USDT. The marketcap of USDT increased, while the marketcap of USDC decreased. Since each is pegged to 1USD, the supply effectively moved.

Stable Coins Liquidity Movement

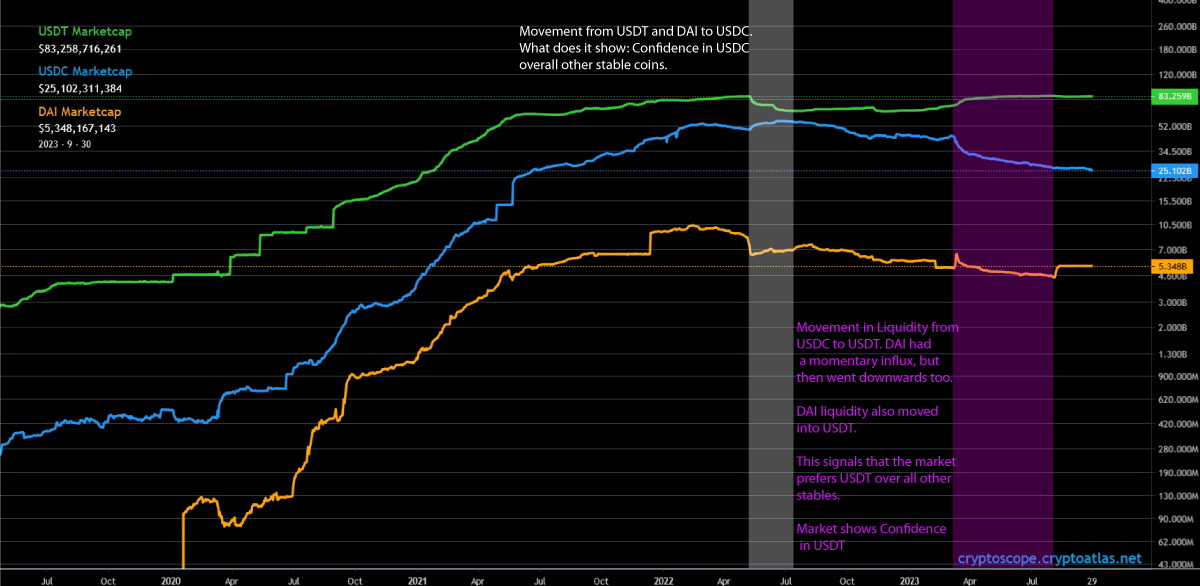
In the chart above, it illustrates how liquidity moved firstly from DAI and USDT to USDC. Combining this knowledge with other charts, we would know that this was in the final stages of the bear run. Also, it was in June-July of 2022, when Terra Luna lost billions and ultimately collapsed.

Then after, more recently, retail investors have been flocking from USDC and DAI and into USDT. This was mainly due to the March 2023 banking crisis. In this time, some banking partners that Circle, USDCs used to store the collagenized USD were going bankrupt.

To hedge their risk, traders began dumping USDC for USDT and DAI. USDC also lost its peg at one point, though it regained it after the banking crisis was resolved.

A conclusion can be made from this analysis. That crypto enthusiasts and retail traders still don’t have confidence in USDC, and that DAI has recently had a surge in marketcap, illustrating a possible trend reversal.