Dominate the Crypto Market: How to Use Bitcoin Dominance Charts Minus Stable Coins
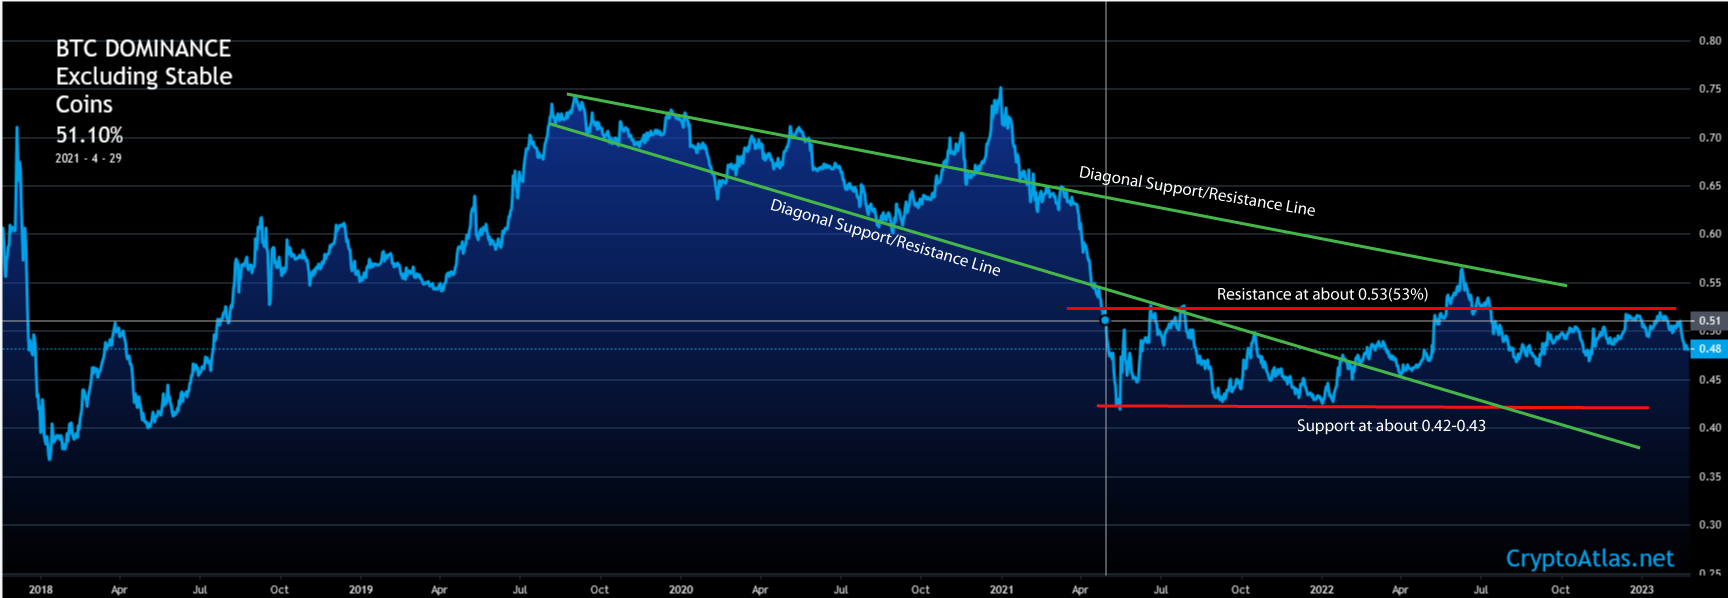
Support and Resistance lines can be drawn to properly estimate when it may be a good time to either exit or enter Bitcoin/Altcoin positions. When the BTCD is at resistance, it may be an indicator that it's time to get some positions on altcoins. Trading BTC:Altcoin pairs is much easier with this tool since it serves as a valuable indicator.
Traders can use the Bitcoind Dominance Chart as an indicator to scalp Bitcoin or Altcoins during their trades.
Below we have an example of some technical analysis performed on the Bitcoin dominance chart and how we can use the chart as an indicator.

Related: The Bitcoin Dominance Explained