Loading...
The current Altcoin Dominance is
The Altcoin Dominance chart is a graphical representation that showcases the proportion of altcoin market capitalization in relation to the total cryptocurrency market. This chart specifically excludes stable coins, providing a focused view on the altcoin segment.
By visualizing the dominance of altcoins, users can grasp the significance of these digital assets within the broader cryptocurrency landscape. It allows investors, analysts, and enthusiasts to observe how altcoins perform in comparison to other market segments, such as Bitcoin or stable coins, and gain insights into the shifting dynamics of the altcoin market.
As a historical chart, the Altcoin Dominance chart displays data over a significant period, enabling users to analyze long-term trends and patterns. It serves as a valuable resource for understanding the growth and evolution of altcoins in the cryptocurrency industry.
By examining the Altcoin Dominance chart, individuals can identify periods of increased altcoin market dominance or potential shifts in market sentiment.
This information can be leveraged to assess market conditions, anticipate potential investment opportunities, and develop informed strategies. Stay informed with the Altcoin Dominance chart and unlock a deeper understanding of the altcoin market dynamics.
The landscape of digital currencies is vast and diverse, but a select few have consistently dominated the charts, representing a significant chunk of the altcoin market.
By excluding stable coins, the genuine heavyweights in the altcoin arena are brought into sharper focus. Among these, Ethereum, BNB, and XRP have emerged as some of the most influential in driving altcoin dominance.
Ethereum, often heralded as the pioneer after Bitcoin, is much more than just a cryptocurrency. It's a platform for decentralized applications and smart contracts, which has opened new horizons for blockchain implementations.
The Ethereum blockchain's adaptability has made it a hotspot for developers, and its native token, Ether, reflects its robust utility and widespread adoption, considerably contributing to altcoin dominance.
BNB was initially launched as a utility token for the Binance cryptocurrency exchange. However, its evolution didn't stop there. The introduction of the Binance Smart Chain revolutionized its scope, making BNB integral for various decentralized transactions and applications within its ecosystem.
Its consistent growth and versatile use cases have ensured its position as a significant force in the altcoin market.
Lastly, XRP stands apart with its unique value proposition. Unlike many other cryptocurrencies, XRP targets the traditional banking sector, aiming to streamline and expedite cross-border transactions.
Backed by Ripple, this digital asset seeks to bridge the gap between conventional finance and the new world of cryptocurrencies, solidifying its influence and importance in the altcoin hierarchy.
The Altcoin Dominance metric provides a valuable snapshot of how alternative cryptocurrencies fare in comparison to Bitcoin, especially when stable coins are excluded to accentuate volatility and innovation. However, like any measurement tool, it has its constraints.
For one, dominance does not inherently indicate the health, utility, or potential return on investment of any specific altcoin. A high dominance could result from a few large-cap altcoins performing exceptionally well, while the vast majority may be languishing or even depreciating.
Additionally, dominance as a metric can sometimes paint a skewed picture, especially in a rapidly evolving market. New altcoin projects are continuously being launched, and existing ones can undergo significant changes in terms of technology, governance, or partnerships.
To provide users with the most current snapshot of the altcoin market's dynamics, the Altcoin Dominance Chart, excluding stable coins, is diligently updated every day at 5pm PST. This ensures that investors, enthusiasts, and analysts access timely and relevant data, capturing the day-to-day fluctuations and trends within the crypto ecosystem.
In the dynamic arena of cryptocurrency, where market sentiments can pivot in an instant, real-time data becomes a trader's most reliable ally.
The Altcoin Dominance Chart, continuously updated, ensures that investors and enthusiasts stay abreast of the ever-evolving trends, capturing the nuances of altcoin market shifts as they occur. This immediacy isn't just about staying informed; it's about maintaining a competitive edge.
Having 24/7 updates means that no significant market movement goes unnoticed. For traders, it translates to making timely and strategic decisions, reducing the risk of missed opportunities.
For analysts and researchers, it offers an unbroken narrative of market behavior, allowing for more accurate trend predictions and deeper insights. In a realm defined by its volatility, real-time data is the beacon that guides informed decisions and successful strategies.
Altcoin dominance, which represents the market capitalization of all alternative cryptocurrencies relative to the total crypto market cap, is a powerful indicator of market sentiment and risk appetite.
When altcoin dominance rises, it typically suggests a broader interest in altcoins, hinting at a bullish sentiment. In such scenarios, traders and investors might be diversifying their portfolios, looking beyond Bitcoin to capitalize on potential high-reward opportunities presented by lesser-known coins.
On the flip side, a decreasing altcoin dominance often indicates a flight to the perceived safety of Bitcoin, especially during market downturns or increased volatility.
As investors consolidate back into Bitcoin, altcoin prices can face downward pressure, while Bitcoin's price might stabilize or increase. It's essential to monitor this trend as it provides vital insights into market dynamics, helping traders predict potential price movements and adjust their strategies accordingly.
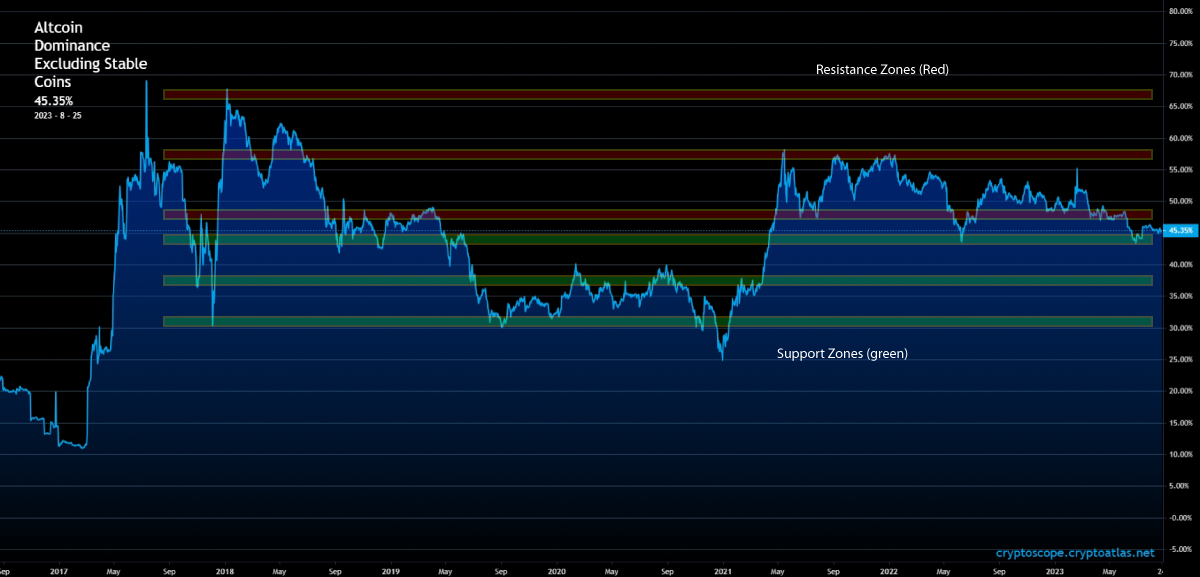
The altcoin dominance chart can be used to gather powerful altcoin market insights. We can learn about zones where the altcoin market has weakness. We can learn about zones in which it may not be a great idea to enter the market. One of the best forms of technical analysis is support and resistance.
Support and resistance zones offer traders insights on the likelihood of the direction in which the altcoin market is headed towards.
When the altcoin dominance is at a significant resistance zone, the likelihood of the altcoin market getting “rejected” and going back lower Is high. Using the resistance zone as an indicator can become a powerful tool.
When the altcoin dominance is at a significant support zone, the probability that the altcoin market is going to “bounce” and tread back up higher is high. This can become a great indicator to use when assessing when to get into the markets.
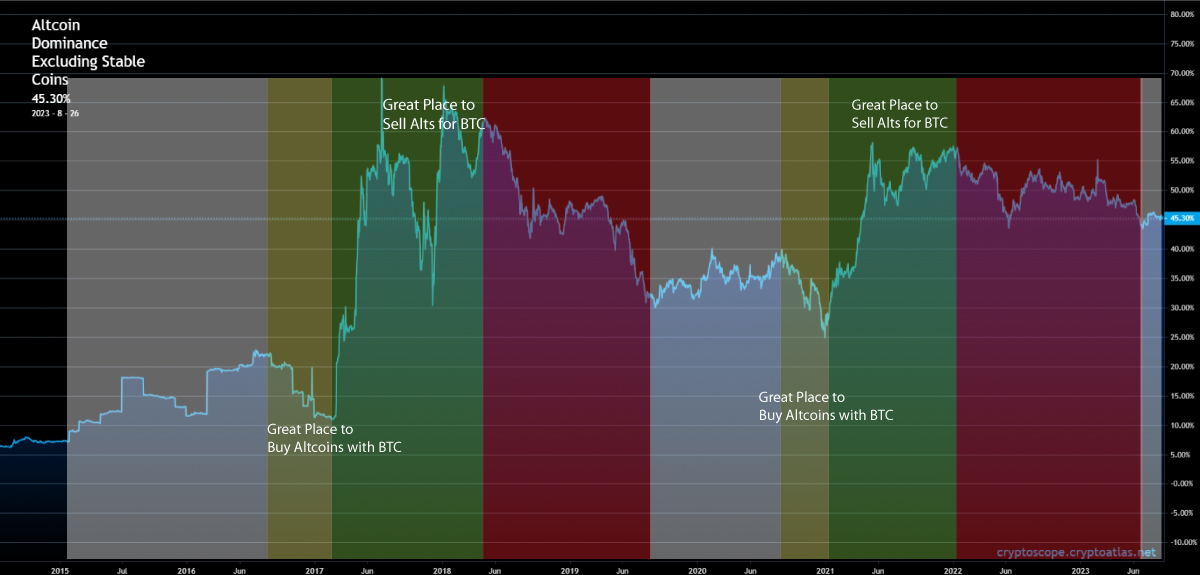
The altcoin dominance can be used to farm Bitcoin. Here is how, but first there is one caveat to understand. There is a difference between crypto and bitcoin. There will only ever be 21 Million Bitcoins. People can create an infinite number of altcoins. Thus, this strategy is based on the intent to acquire more Bitcoin.
There are two factors that allow traders to farm Bitcoin. The First one is that Altcoins are speculative in nature and often outperform Bitcoin in the cycle. New altcoins are created every year. Secondly, like the Bitcoin Dominance, the Altcoin dominance is cyclical. These two factors allow traders to buy altcoins at the bottom of the cycle and sell them for Bitcoin at the top of the cycle, rinse, and repeat.
Let’s take a look at the altcoin dominance to see how it is cyclical and how different phases of the cycle can help traders farm Bitcoin using altcoins.
The strategy here is to cycle in and out of altcoins with the attempt to increase your BTC position. This strategy never touches fiat currencies or stable coins.
Stable coins, by their inherent design, aim to maintain a stable value by pegging to external assets like fiat currencies. Including them in the Altcoin Dominance metric can distort the true picture of market sentiment, as their values don't fluctuate with the same volatility as traditional altcoins.
Excluding stable coins offers a clearer lens to gauge the market's appetite for risk and innovation, as the altcoin dominance then truly reflects investor confidence in the growth potential and utility of decentralized assets.
Furthermore, stable coins serve primarily as a means of liquidity and a safe harbor during volatile market conditions. They don't necessarily represent the technological advancements, utility, or speculative interest that other altcoins embody. By sidelining them from the Altcoin Dominance chart, we ensure a more accurate representation of the altcoin ecosystem's dynamism and potential.
Our chart excludes major stablecoins such as USDT, USDC and DAI as well as more than 20 different Stable coins, providing you a more accurate representation of the true Altcoin Dominance.