Loading...
The current Binance Coin (BNB) Dominance is
In the vast and evolving realm of cryptocurrencies, understanding the concept of "dominance" is crucial for investors, traders, and enthusiasts alike.
Binance Coin (BNB) dominance refers to the percentage of the total cryptocurrency market capitalization that BNB occupies, showcasing its relative significance and clout within the ecosystem.
Just as Bitcoin dominance reflects its market share, BNB dominance offers a lens into the coin's standing in comparison to other cryptocurrencies.
Excluding stable coins from this equation provides a clearer perspective. Stable coins, being pegged to traditional fiat currencies or other assets, often exhibit less volatility and, therefore, can skew the dominance metrics.
By focusing solely on BNB's dominance without these stable coins, we gain a more precise insight into its genuine market position. This approach helps investors and traders to make more informed decisions based on BNB's intrinsic strength and influence in the crypto world, unobscured by the often-steady influence of stable coins.
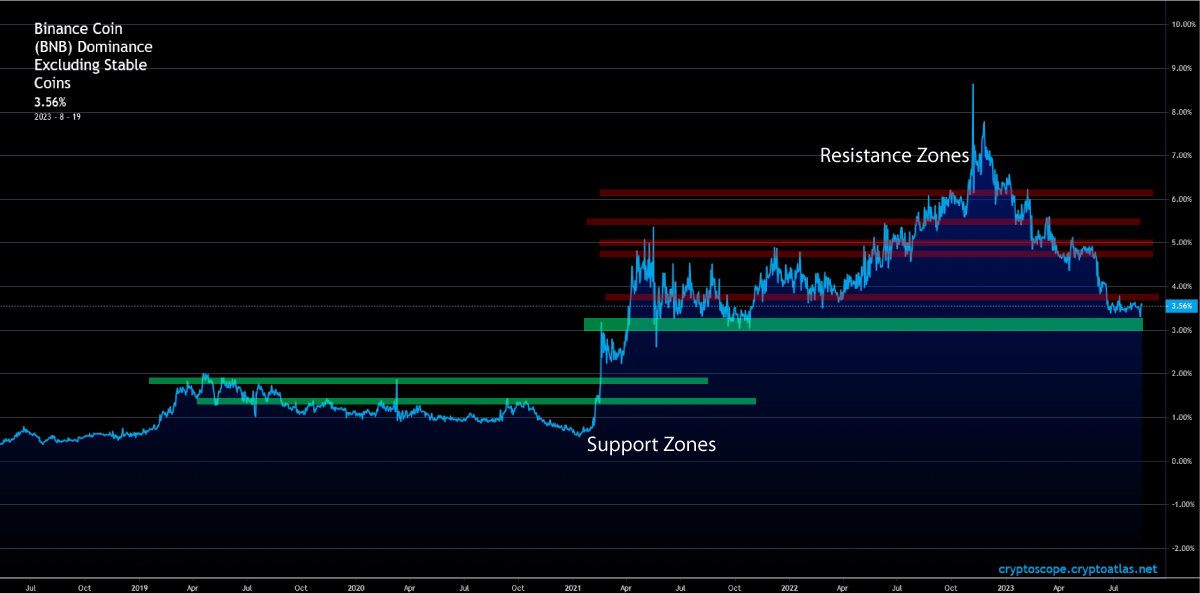
Classical technical analysis such as support and resistance lines can prove to be a valuable indicator to retail traders, investors and speculators. The Binance Coin Dominance chart respects support and resistance lines to a great degree.
Much like traditional assets or even price charts of popular cryptocurrencies, the Binance Dominance can get rejected or bounce off of support and resistance zones.
In the chart below we can see some support and resistance zones within the Binance coin Dominance excluding stable coins chart.
The Binance Coin Dominance chart can also be used as an indicator to get a perspective of how the Binance Coin is competing against the rest of the cryptocurrency market.
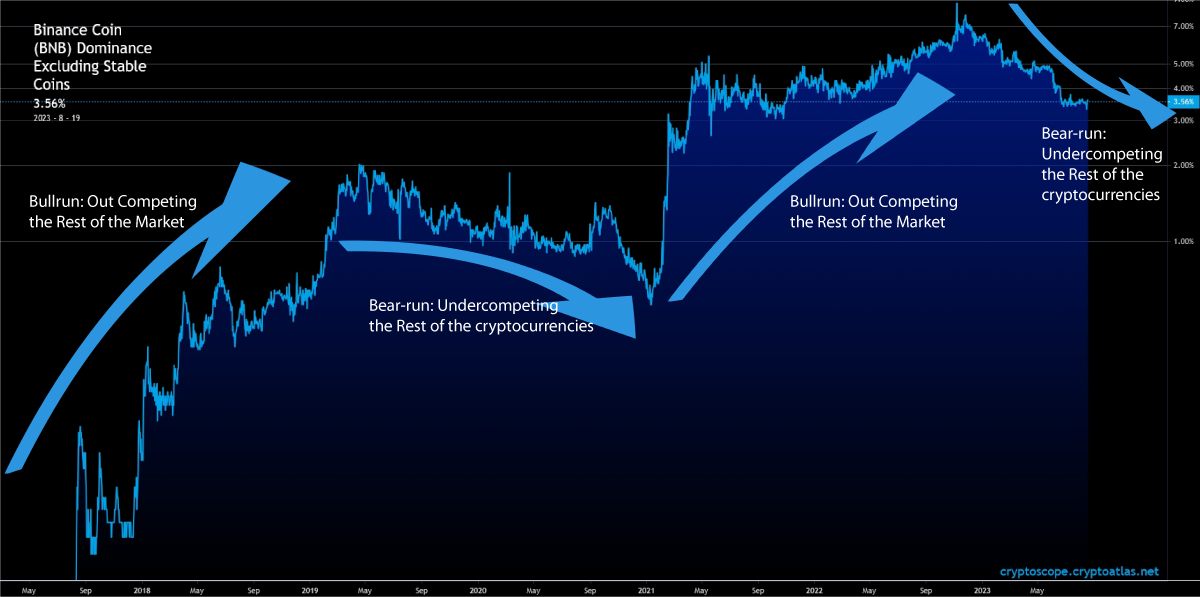
A Bull rally within the Binance coin dominance chart indicates that Binance Coin is outcompeting all other assets in the crypto-space. When this trend is finished, it is a great indicator which shows analysts that the broader market may be outperforming Binance coin.
At this point holding Binance Coin as opposed to other cryptocurrencies makes less sense.
When the Binance Coin Dominance chart is in a bull or bear trend, it doesn’t necessarily mean that Binance coin is going up or down in USD value, but rather how it is performing relative to the rest of the cryptocurrencies.
They say the trend is your friend until the end. Buying Binance Coin when the BNB dominance chart is in a bear trend may not make you lose money, but your cryptocurrency portfolio certainly won’t outperform other coins such as BTC or Ethereum.
It can also be vice versa too, buying BNB Coin within a bear trend of the Dominance chart may result in both USD losses and in being outperformed by the rest of the cryptocurrency market.
In the illustration below we illustrate bull and bear trends of the Binance Coin Dominance Excluding Stable Coins Chart.
In the rapidly evolving landscape of cryptocurrency, the Binance Coin (BNB) dominance offers a pivotal snapshot, representing BNB's proportionate share of the total cryptocurrency market cap, devoid of the influence of stable coins.
This metric, at its core, provides a laser-focused view of BNB's standing amidst a vast sea of digital assets, elucidating its relative strength and significance in the market.
Given the dynamic nature of the crypto sphere, a 24-hour window can herald significant changes, underscoring the need for daily updates.
By automatically updating the BNB dominance chart once every day, we ensure that traders, investors, and crypto enthusiasts access the most current data, reflecting BNB's exact position in real-time.
This granularity of information, especially when stable coins are excluded, becomes a powerful tool for deciphering market sentiments, understanding shifts, and formulating strategies.
A daily-refreshed perspective on BNB dominance aids in drawing accurate inferences, enabling market participants to make informed decisions and stay abreast of the coin's trajectory.
Understanding the Binance Coin (BNB) dominance is crucial for anyone keen on cryptocurrency market dynamics.
It's a pivotal indicator that provides traders, investors, and crypto enthusiasts with a sense of BNB's market standing in relation to other cryptocurrencies, showcasing its relative strength, significance, and influence within the broader digital asset ecosystem.
However, it's vital to grasp the distinction between volatile assets like BNB and stable coins. Stable coins, designed to minimize volatility, have their value pegged, typically to fiat currencies such as the US dollar.
This design means they don't exhibit the characteristic price swings seen in other cryptocurrencies. Including them in dominance calculations can therefore obscure the genuine dynamics at play, potentially offering a misleading representation of BNB's relative power in a market that's defined by its volatility.
Excluding stable coins from BNB dominance analysis ensures that the metric remains a true reflection of BNB's position in the volatile crypto market landscape.
By concentrating solely on cryptocurrencies that experience market-driven value fluctuations, the "Binance Coin(BNB) Dominance Excluding Stable Coins Chart" delivers an unambiguous, undistorted perspective.
This clarity empowers traders and investors to make informed decisions, relying on a metric that genuinely captures BNB's market relevance and potential trajectory.
The Binance Coin (BNB) Dominance Chart above excludes many, if not all currently available stablecoins available to investors. Down below is a list of the Stable Coins excluded in the BNB dominance value calculations which are used as data points for the chart above.